Your heart keeps blood moving between the lungs and the rest of the body. Blood delivers oxygen and nutrients and carries away carbon dioxide and other wastes. The two sides of the heart work together: the right side sends blood toward the lungs; the left sends it toward the body. Follow the route, then slow a beat down to see how the chambers and valves coordinate.
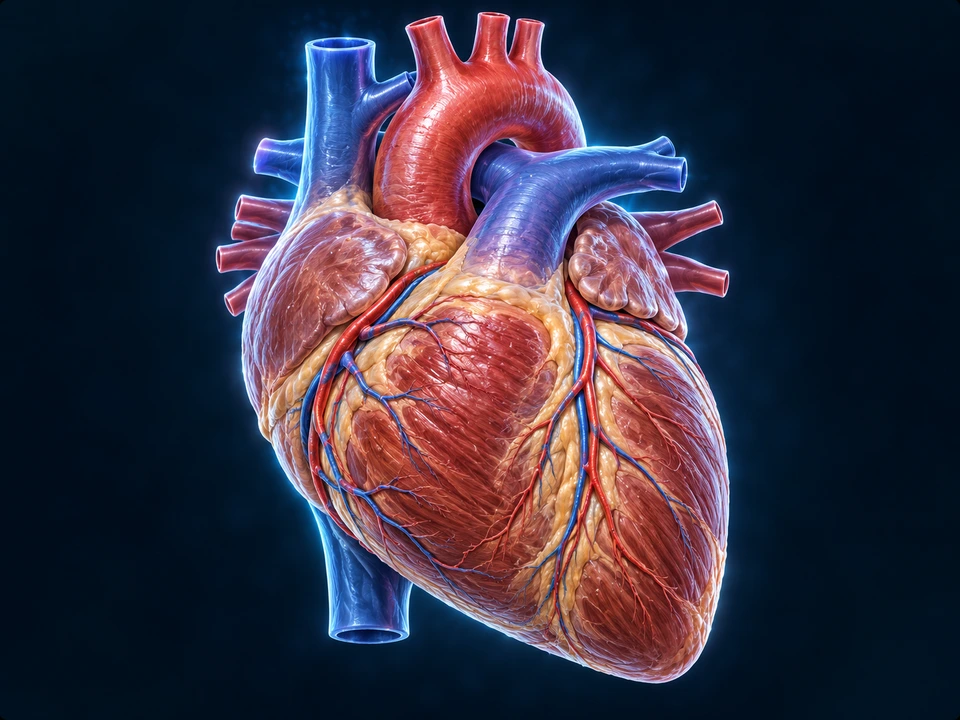
Anterior anatomical context: patient right is viewer left. Generated atlas illustration; blood is never literally blue.
Surface anatomy introduces position and connections. Hidden roots and fine vascular branches are illustrative, not an angiogram or a measured anatomical specimen.
AT A GLANCE · ONE CONTINUOUS CIRCULATION
A lung circuit. A body circuit. Connected pumps.
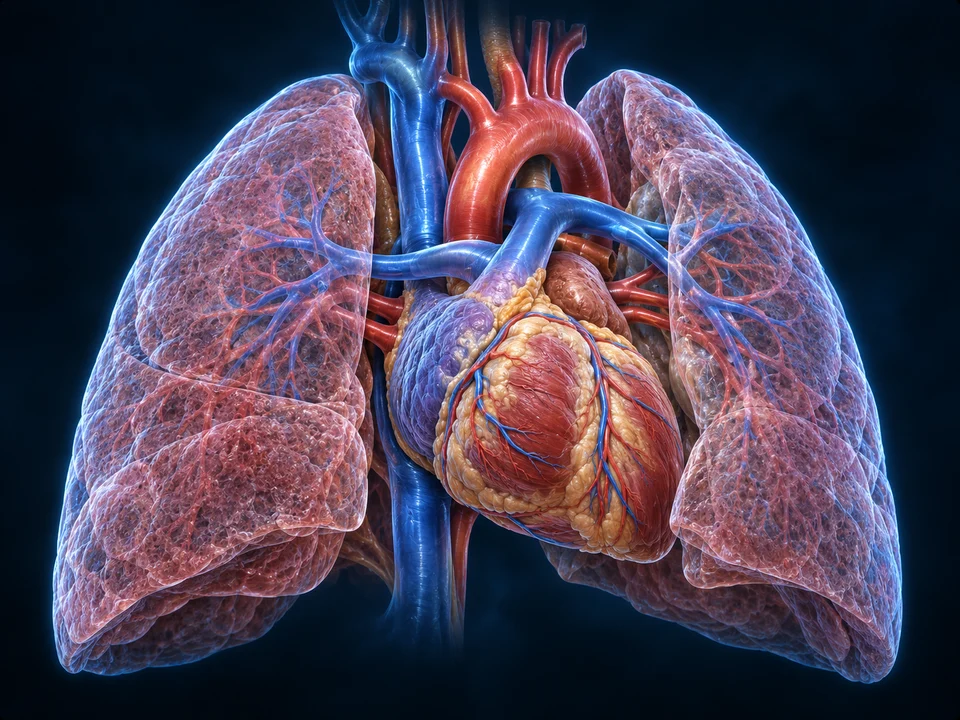
Find the heart between the lungs. Then distinguish blood sent toward gas exchange, returning blood and supply to the body. A front view reveals some vessel segments and hides other connections.
1Right ventricle
2Pulmonary arteries
3Lung capillaries
Generated organ context, not CT or a complete vessel-root reconstruction. Red/blue convention distinguishes relative oxygen content; hidden pulmonary veins and fine lung vessel trees are not individually mapped.
The next destination is the lungs.
The right ventricle sends blood into the pulmonary trunk and arteries. Exchange takes place in the lung capillary beds, rather than inside a large blue vessel.
Red and blue are teaching conventions for relative oxygen content. Neither line width nor emphasis measures blood flow.
Deeper learning · equal average flow is not equal pressure
The two pumps are connected in series. In a stable continuous circulation, their average outputs match, even though the left ventricle generates a larger pressure rise. This does not mean every organ receives the same fraction of flow or that a highlight predicts a person’s response.
The lungs contain a gas-exchange capillary bed; most systemic organs receive branches arranged alongside one another. Portal routes add further capillary networks, such as the intestinal-to-liver connection described below. Keep this organization distinct from the heart wall’s own coronary supply.
Evidence: NHLBI · How Blood Flows through the Heart · OpenStax · Cardiac Cycle. Existing original atlas retained; six anatomical positions and five visible local direction segments checked separately from fine branching. No human medical review or patient-specific circulation simulation is claimed.
STRUCTURE BEFORE SIMULATION
Connect the heart and lungs in source anatomy.
Use the existing adult male reference to locate the major receiving spaces, outflow vessels and paired lung context. The chapter preparations explain flow and exchange; the source surfaces do not simulate those processes.
Related learning, not a new approved anatomical representation. Existing source credits remain visible in the viewer. No new model, blood-flow measurement or patient treatment instruction is added.
Chapter overview video: planned. No video or playback duration is currently available; these visible lessons provide the teaching.
Gross anatomy
Receiving spaces. Pressure-generating walls.
A selected opening reveals relationships that the exterior cannot show. It is a teaching reconstruction, not a single plane through every vessel root.
Major chamber regions are visible. Hidden outlet roots, valve details and tissue dimensions are not measured from this generated opening.
Four chambers, two destinations
The right and left atria receive returning blood. Below them, the ventricles generate the pressure that sends it onward. A septum separates the right and left sides. The left ventricular wall is thicker than the right because it must generate greater pressure for systemic circulation. “Right” and “left” always mean the person’s own sides, not the viewer’s.
The heart sits between the lungs in the mediastinum, behind the breastbone and above the diaphragm. It is tilted rather than upright: its pointed apex is directed downward and toward the person’s left. A surrounding sac, the pericardium, helps protect it and provides a low-friction setting for movement.
The lungs are a lower-pressure destination than the body circuit. The more muscular left ventricle develops a greater pressure rise. In a stable continuous circulation, the two pumps nevertheless move matching average volumes; one side cannot indefinitely send more blood than the other receives.
Partitions and a supporting framework
Interatrial and interventricular septa separate the blood spaces. Dense connective tissue around valve openings helps maintain their shape and anchors muscle. The fibrous framework also electrically separates atrial from ventricular working muscle; the conducting bundle provides the normal bridge.
The heart wall and its surrounding sac are related structures, not interchangeable names.
Layered gross enlargement, not histology. Thin membranes and the fluid interval are expanded to make their relationships readable.
Three unequal wall layers
Endocardium lines the inner surfaces. Myocardium provides the contracting mass. Epicardium covers the outside and is the visceral layer of the serous pericardium. These are positional and tissue distinctions, not three equally thick slabs.
Two facing serous surfaces
The visceral layer lies on the heart; the parietal serous layer lines the surrounding sac. A small fluid-containing potential space reduces friction between them during movement. Fibrous pericardial tissue lies outside this arrangement.
From the outside
Large vessels connect near the broad upper region, or base. The apex is formed mainly by the left ventricle. Coronary vessels travel across the surface: coronary arteries supply the heart muscle itself, while cardiac veins carry blood away from that tissue. Blood inside a chamber does not replace this dedicated muscle supply.
The broad base faces mainly posteriorly and is formed chiefly by atrial structures; great vessels attach nearby. The anterior surface is largely right ventricular, while the left ventricle contributes strongly to the left border and apex. A front view cannot display every posterior connection.
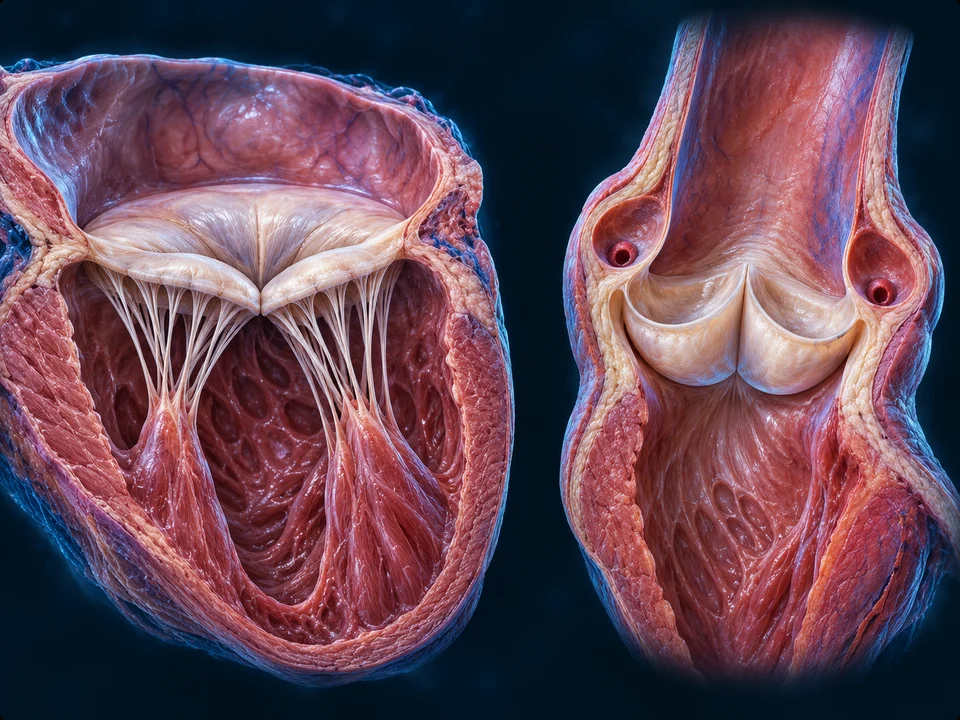
Separate selected preparations compare a mitral inlet with an aortic outlet. They are not one simultaneous snapshot or a shared scale.
Generated selected preparations, shown near closure. Attachment counts, leaflet outlines and fine coronary ostia are illustrative. Labels identify visible support structures; they do not validate an individual valve.
Valves respond to pressure
The tricuspid valve connects the right atrium to the right ventricle; the mitral valve connects the left atrium to the left ventricle. The pulmonary and aortic valves guard the ventricular outlets. Pressure differences open or close these valves. They are not actively operated doors. In the cycle below, notice that there are brief intervals when all four are closed.
Chordae tendineae connect atrioventricular leaflets to papillary muscles. As the ventricle contracts, the supporting system helps prevent the closed leaflets from turning back into the atrium. Forward filling pressure opens the valve; papillary muscle is not its opening handle.
Pockets at the exits
The pulmonary and aortic valves have pocket-like cusps and no chordal tethers. Forward pressure separates them; reversal fills the pockets and brings their edges together. The mitral valve has two main leaflets; the tricuspid has three. Normal semilunar valves have three cusps.
Heart sounds mark events, not pump output
The first heart sound accompanies the onset of ventricular systole and AV-valve closure. The second accompanies semilunar-valve closure near the end of ejection. These vibrations are not proof that a given volume was pumped, and this chapter offers no personal auscultation interpretation.
Blood in a chamber does not nourish the whole wall.
Coronary circulation supplies the working myocardium, then returns blood to the right side.
Selected anterior surface relationships. Fine branching, coronary dominance, precise perfusion territories and hidden arterial origins are not reliably established by this generated image. The coronary sinus is posterior and is not labelled on this view.
Arteries begin at the aortic root
The right and left coronary arteries arise near the base of the aorta. Major left-sided branches include the anterior interventricular artery, often called the LAD, and circumflex artery. Their branches distribute blood to muscle through smaller vessels; individual patterns and dominance vary.
Venous return has its own route
Cardiac veins collect blood from the wall. Most drains through the coronary sinus on the posterior heart into the right atrium; some returns by other smaller venous routes. Do not confuse this local supply with the blood travelling through the ventricular cavities.
Pressure and compression change delivery
Contracting ventricular muscle compresses its embedded vessels, especially in the left ventricular wall. Much left coronary perfusion therefore occurs during diastole. Supply depends on more than a visible surface artery: pressure, resistance and tissue demand all matter.
Connect anatomy with interrupted supply
Reduced coronary flow can deprive muscle of oxygen and impair its work. This explains why coronary supply is a distinct teaching layer. An illustration cannot diagnose narrowing, identify a person’s coronary pattern or determine treatment.
The superior and inferior venae cavae return blood from the body to the right atrium. The pulmonary trunk carries blood from the right ventricle toward the lungs. Pulmonary veins return it to the left atrium. The aorta carries blood from the left ventricle into systemic circulation. Arteries carry blood away from the heart and veins toward it; these names do not tell you its oxygen content.
Pulmonary capillaries lie beside air-filled alveoli, allowing carbon dioxide to leave blood and oxygen to enter it. Systemic capillaries then exchange substances with tissues. Arteries and veins name direction relative to the heart, not whether their blood is oxygen-rich.
1Body → venae cavae → right atrium
2Tricuspid valve → right ventricle
3Pulmonary valve → pulmonary arteries → lungs
4Pulmonary veins → left atrium
5Mitral valve → left ventricle
6Aortic valve → aorta → body
Trace one complete route
Body → venae cavae → right atrium → tricuspid valve → right ventricle → pulmonary valve → pulmonary trunk and arteries → lungs → pulmonary veins → left atrium → mitral valve → left ventricle → aortic valve → aorta → body. The two pumps work during the same beat. Blue and red in this chapter distinguish lower and higher oxygen content; blood is not blue, and the diagrams do not show actual transit times.
Branches supply the brain, kidneys, muscles and other tissues according to local needs. Portal routes add a second capillary bed before return to the heart: intestinal venous blood, for example, passes through the liver. This organ context is a learning connection, not a diagram of every systemic branch.
A beat alternates filling and ejection, with brief closed-valve transitions. Most ventricular filling occurs before atrial contraction. As ventricular pressure rises, the inlet valves close; the outlets open only when ventricular pressure exceeds the pressure ahead. After ejection, falling pressure closes the outlets. Filling resumes when ventricular pressure drops below atrial pressure. The ventricles retain blood after ejection. This slowed schematic explains order, not a measured heartbeat or a medical simulation.
Original generated phase preparation. The same source contains four selected states. Chamber shapes show qualitative differences; they do not measure volume, pressure or duration. Hidden outflow anatomy is not traced as a verified route.
Atrial pressure exceeds ventricular pressure, allowing filling through the mitral valve. Atrial contraction adds a final contribution; most filling has already occurred. Ventricular volume increases.
Gold marks a local forward-flow direction only when the illustrated valve is open. Both closed-valve phases have no through-valve arrow. Compare the fuller chamber during pressure rise with the residual chamber during relaxation.
Deeper learning · the same gates, different phases
Both valves can be closed while pressure rises or falls. Valve position alone does not tell you which transition is occurring: the preceding event, chamber filling and direction of pressure change matter. A closed-valve ventricle is still active living tissue.
The two mitral leaflets and their supports are different from the untethered aortic cusps. The source-supported sequence is shown for the left heart; the original four-valve guide below retains the paired right-heart teaching. These preparations are qualitative, not a patient pressure–volume recording or a measurement of filling time.
Returning blood flows into relaxed ventricles. Most filling occurs before the atria contract.
2 · Atrial contraction
The atria contract, adding the final part of ventricular filling.
3 · Ventricular contraction
The ventricles build pressure with all valves closed, then eject blood through the outlet valves.
4 · Early relaxation
The ventricles relax. Their outlets close, and all four valves remain briefly closed before filling resumes.
Existing source-based four-stage cycle model retained. Valve states are a supporting guide; all essential stage explanations are visible above. Not a measured pressure trace, moving chamber simulation or treatment decision.
All closed does not mean inactive
During isovolumetric contraction, ventricular pressure rises while inlet and outlet valves are closed. After ejection, isovolumetric relaxation reduces pressure with all valves closed again. Volume changes mainly during filling and ejection; pressure can change before blood moves across an outlet.
Not all the blood leaves
End-diastolic volume is the blood present after filling. End-systolic volume remains after ejection. Their difference is stroke volume. Ejection fraction is that difference divided by end-diastolic volume, not the percentage of the whole body’s blood pumped in one beat.
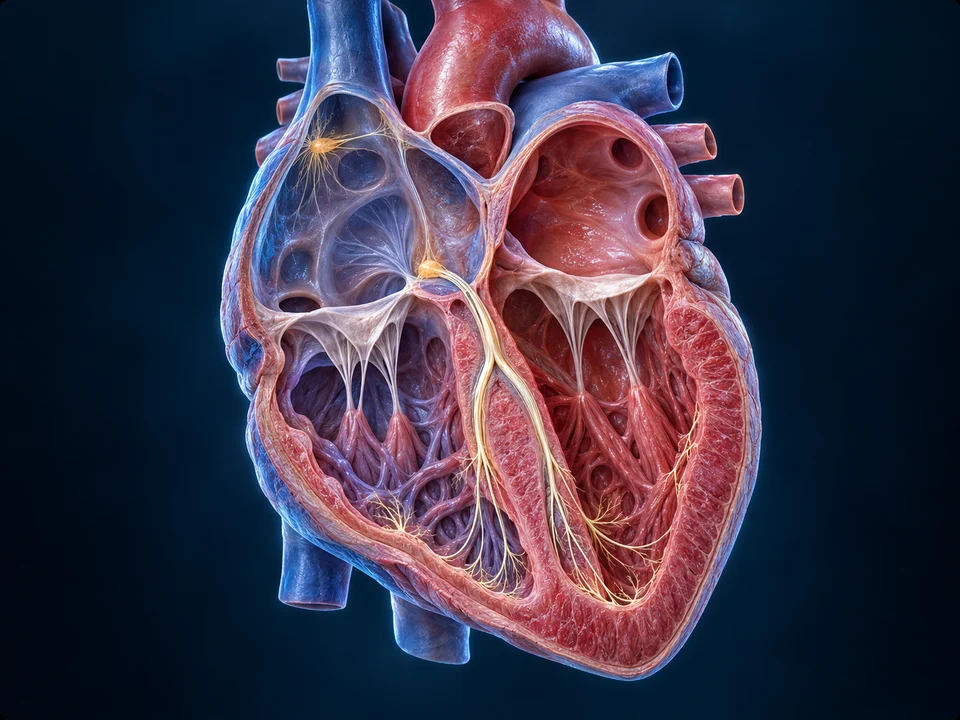
The highlighted network is a teaching overlay within anatomy. Blood does not flow along it.
Generated gross anatomical context. The slender highlighted paths enlarge structures that are not normally visible this way; exact fibre routes, node dimensions and bundle counts are not measurements or independently resolved anatomy.
An electrical sequence sets the order
The sinoatrial node in the right atrium normally starts the signal. Activation spreads through the atria, followed by a delay at the atrioventricular node. The signal then travels through the atrioventricular bundle, bundle branches and Purkinje network to coordinate ventricular activation. Electrical activity precedes contraction. A signal pathway is different from the route blood follows, so it has a separate visual key here.
Pacemaker cells can initiate rhythmic electrical activity. Working muscle cells respond with an action potential followed by force development. The normal SA-led sequence coordinates atrial and ventricular timing; nerves modulate it rather than giving the heart a separate command for every beat.
Supporting, uncalibrated teaching trace. P: atrial depolarization. QRS: ventricular depolarization. T: ventricular repolarization. An ECG records summed surface electrical signals, not a direct pressure, blood-flow or contraction curve. Wave amplitude, intervals and morphology here are not patient data.
What an ECG records
Surface electrodes detect the combined electrical activity of the heart. The P wave relates to atrial depolarization; QRS to ventricular depolarization; T to ventricular repolarization. Atrial repolarization is usually obscured by QRS. This uncalibrated supporting trace is a concept guide, not a patient recording.
Separate electrical and pressure signals
An ECG is not a pressure curve or a direct measurement of flow. Electrical activation triggers mechanical events after a delay. The AV delay helps the sequence; rapid ventricular conduction distributes activation. Reading a waveform requires clinical context beyond this chapter.
A tissue enlargement explains structures; a separately sourced microscope photograph shows actual acquired evidence.
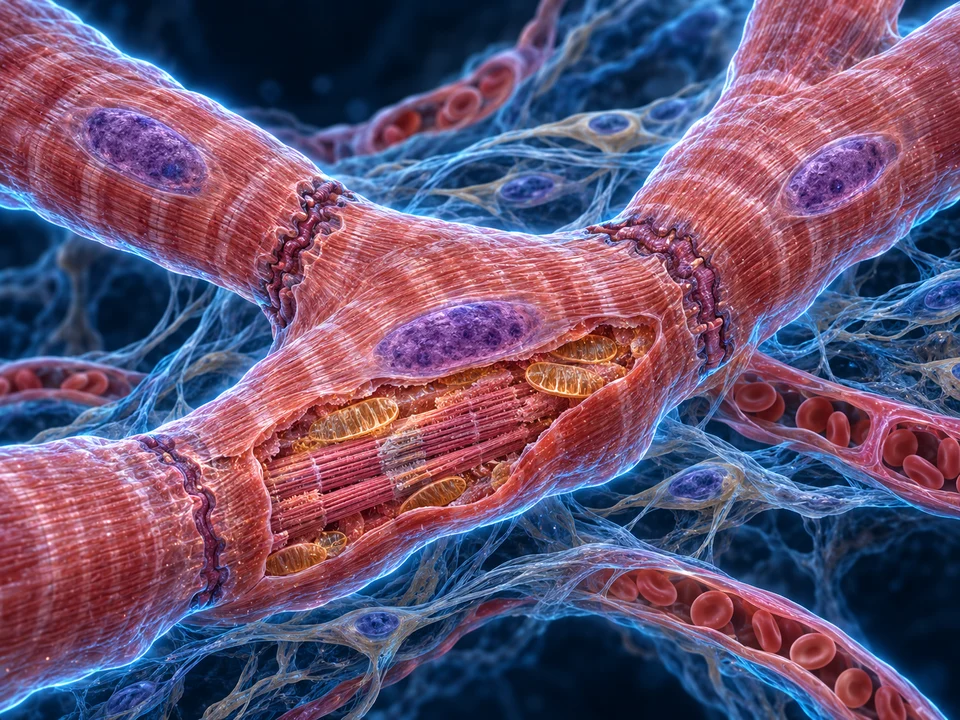
Generated atlas enlargement, not light or electron microscopy. Cell boundaries, nuclei, sarcomere detail and mitochondria are enlarged selectively; quantities, dimensions and individual junction proteins are not literal observations.
Joined without becoming one giant cell
Cardiac cells are striated and usually branched. Intercalated-disc regions connect neighbours mechanically and electrically. Adhesive junctions resist separation while gap junctions allow ionic communication. These contacts coordinate tissue; they do not erase the cells’ separate membranes.
Calcium links excitation with contraction
Electrical activation changes membrane ion movements. Calcium entry helps trigger additional calcium release inside a working cell. Calcium permits the contractile machinery to develop force; removal from the cytoplasm supports relaxation. The illustration explains location, not a measured action potential.
Deeper learning · calcium, filaments and relaxation
Calcium binding to troponin changes the position of the troponin–tropomyosin regulatory system on the thin filament. This makes actin sites available for myosin interactions; ATP supports repeated cross-bridge cycling. The filaments slide rather than shortening themselves.
A trigger influx of calcium through the cell membrane helps recruit calcium release from the sarcoplasmic reticulum, an internal store. Lowering cytoplasmic calcium allows relaxation: transport back into the store and out across the cell membrane have different roles. These molecular locations are not resolved as individual channels in the regional tissue picture.
Repeated actin–myosin units give cardiac muscle its striations. Their sliding changes sarcomere length and develops tension; filaments do not simply shrink. ATP supports the cross-bridge cycle and calcium handling, while abundant mitochondria help supply sustained energy.
A long refractory period matters
Working cardiac muscle has a prolonged electrical response and refractory period. This limits repeated summation into a sustained tetanic contraction, allowing the chamber to relax and refill. Pacemaker and ventricular muscle action potentials are different; the same generic trace should not represent both.
Authentic acquired light-microscope image. Uploader reports 400×; stain and specimen species are not established here. Web display enlargement is not acquisition magnification.
Alexander G. Cheroske · original source · CC BY-SA 4.0. Proportional WebP resize, no crop, recolour or AI; metadata omitted from public derivatives. Adaptation remains CC BY-SA 4.0.
Look for evidence, not the render’s exact shapes
Striations and elongated nuclear profiles are visible in the photograph. Some transverse dark interfaces can be seen, but every cell boundary is not distinct. A selected light-microscope field does not reveal every junction component drawn in an atlas enlargement.
What this specimen cannot establish
The full source image is retained. A dark band is not independently identified here as a particular junction protein. Nuclei are not a cell-count measurement, and the uploader’s magnification does not provide a calibrated screen scale. We do not label the unknown-species specimen as confirmed human tissue.
Cardiac output is the volume pumped by one ventricle per minute: heart rate multiplied by stroke volume. It is different from arterial pressure, which also depends strongly on vascular resistance. The simple example below isolates the arithmetic; it is not a model of a particular person’s circulation.
Filling, load and force
Preload describes the initial stretch associated with ventricular filling. Afterload is the load against which blood must be ejected. Contractility describes intrinsic force development at a given initial stretch. These factors affect stroke volume together; none is merely a synonym for heart rate.
Local response to returning blood
Within physiological limits, greater filling stretch can increase the force of the following contraction—the Frank–Starling relationship. This helps match output to venous return. It is not an unlimited rule that an ever larger chamber always pumps better.
Nerves and hormones modulate the pump
Sympathetic activity tends to increase rate and force; parasympathetic vagal activity primarily slows pacemaker rate. Circulating adrenaline can increase cardiac activity. Reflex feedback from pressure-sensing receptors links the heart with blood vessels, while local tissues adjust delivery according to demand.
Rate and volume are different contributions
Cardiac output = heart rate × stroke volume. In the example below, 70 beats/min × 70 mL/beat gives 4.9 L/min.
These independent chosen values demonstrate the equation only. They do not model filling-time effects, individual normal ranges, contractility, disease, ejection fraction or an exercise response. No personal measurement or recommendation.
Actual exercise changes filling time, venous return and muscle performance together. The controls are bounded arithmetic examples, not personal normal ranges, an exercise forecast, ejection-fraction calculator or medical advice.
Original educational explanations build on the retained Heart anatomy, valve and cycle material. The full-book records FB078–081 establish the teaching scope—heart structure, valves, muscle and blood flow, and the heartbeat—not copied text or pictures. Independent sources below support the medical relationships.
Generated plates provide selected anatomical context, not patient scans, literal microscopic observations or exact fine-vessel maps. Labels and concise meanings remain visible; enlargement preserves their correspondence. Genuine microscopy has its own source and licence. Source checks and AI visual inspection are not human medical review; no human medical review is claimed. Physical-phone acceptance remains pending. Further scope: authenticated valve-specimen photographs, cardiac CT/MRI/angiography, quantitative pressure–volume recordings and separate disease education. No unavailable video, diagnosis or treatment capability is implied.
 Pressure opens a valve
 A signal before force
 From organ to cells


